Introduction
This example considers a peculiar case of Functional Analysis: the one in which the mere presence of any function at all is questionable. It deals with the existential question only, rather than with the detailed determination and characterization of functionality and performance: it turns out that the first step in defining the functionality of a black box is to prove that there is some. Isolation of this fundamental notion is my rationale for including this example.
It is worth pointing out that I’m no more familiar with the internal design of the controllers now than I was then…which is to say “not very much”. I was, however, intimately familiar with the requirements that drove the logic implemented therein. The underlying design of hardware and most of the software (however) was wrapped around a speed-controlled pump fan controller. It had many internal features that were not traceable to our applications as servo and torquer.
My Standard Caution About Examples applies to this page.
Test Setup Overview
The subject test setup is shown in Figure 1. Centered in the Figure is a panel of five (5) motor controllers and two (2) electrical power conditioners. Four such panels exist in the UUT. Each controller runs one of 20 independent motors in the complete machine. Four of the motors actuate mechanisms during two classes of event; the other 16 each actuate a unique instance of a different type of mechanism during two different classes of event. The machine’s complete functionality relies on the coordinated performance of all 20 actuated devices. In all cases, each mechanism is controlled independently of all others.
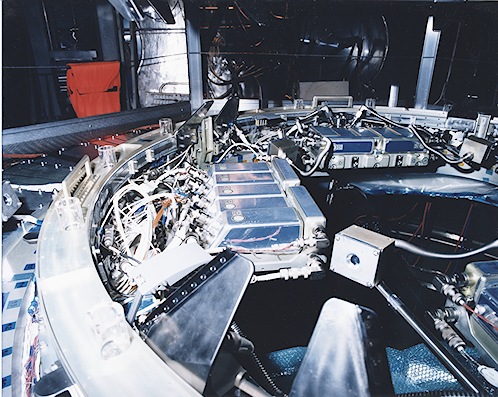
Each panel accommodates one (1) instance of the first mechanism class, and four (4) of the second class. The former class controller also acts as a bi-directional conduit for command and control to the entire panel. One (1) panel acts as a bi-directional conduit for command and control to the entire machine of 20 actuated mechanisms.
In the normal course of operations, whether test or flight, operator software is used to command and monitor the machine from a stand-alone computer (e.g., PC-compatible). For the test software, the status of all controllers was shown on the user screen. The display color-coded most of the output according to message type (and, in some cases, range of sensed value).
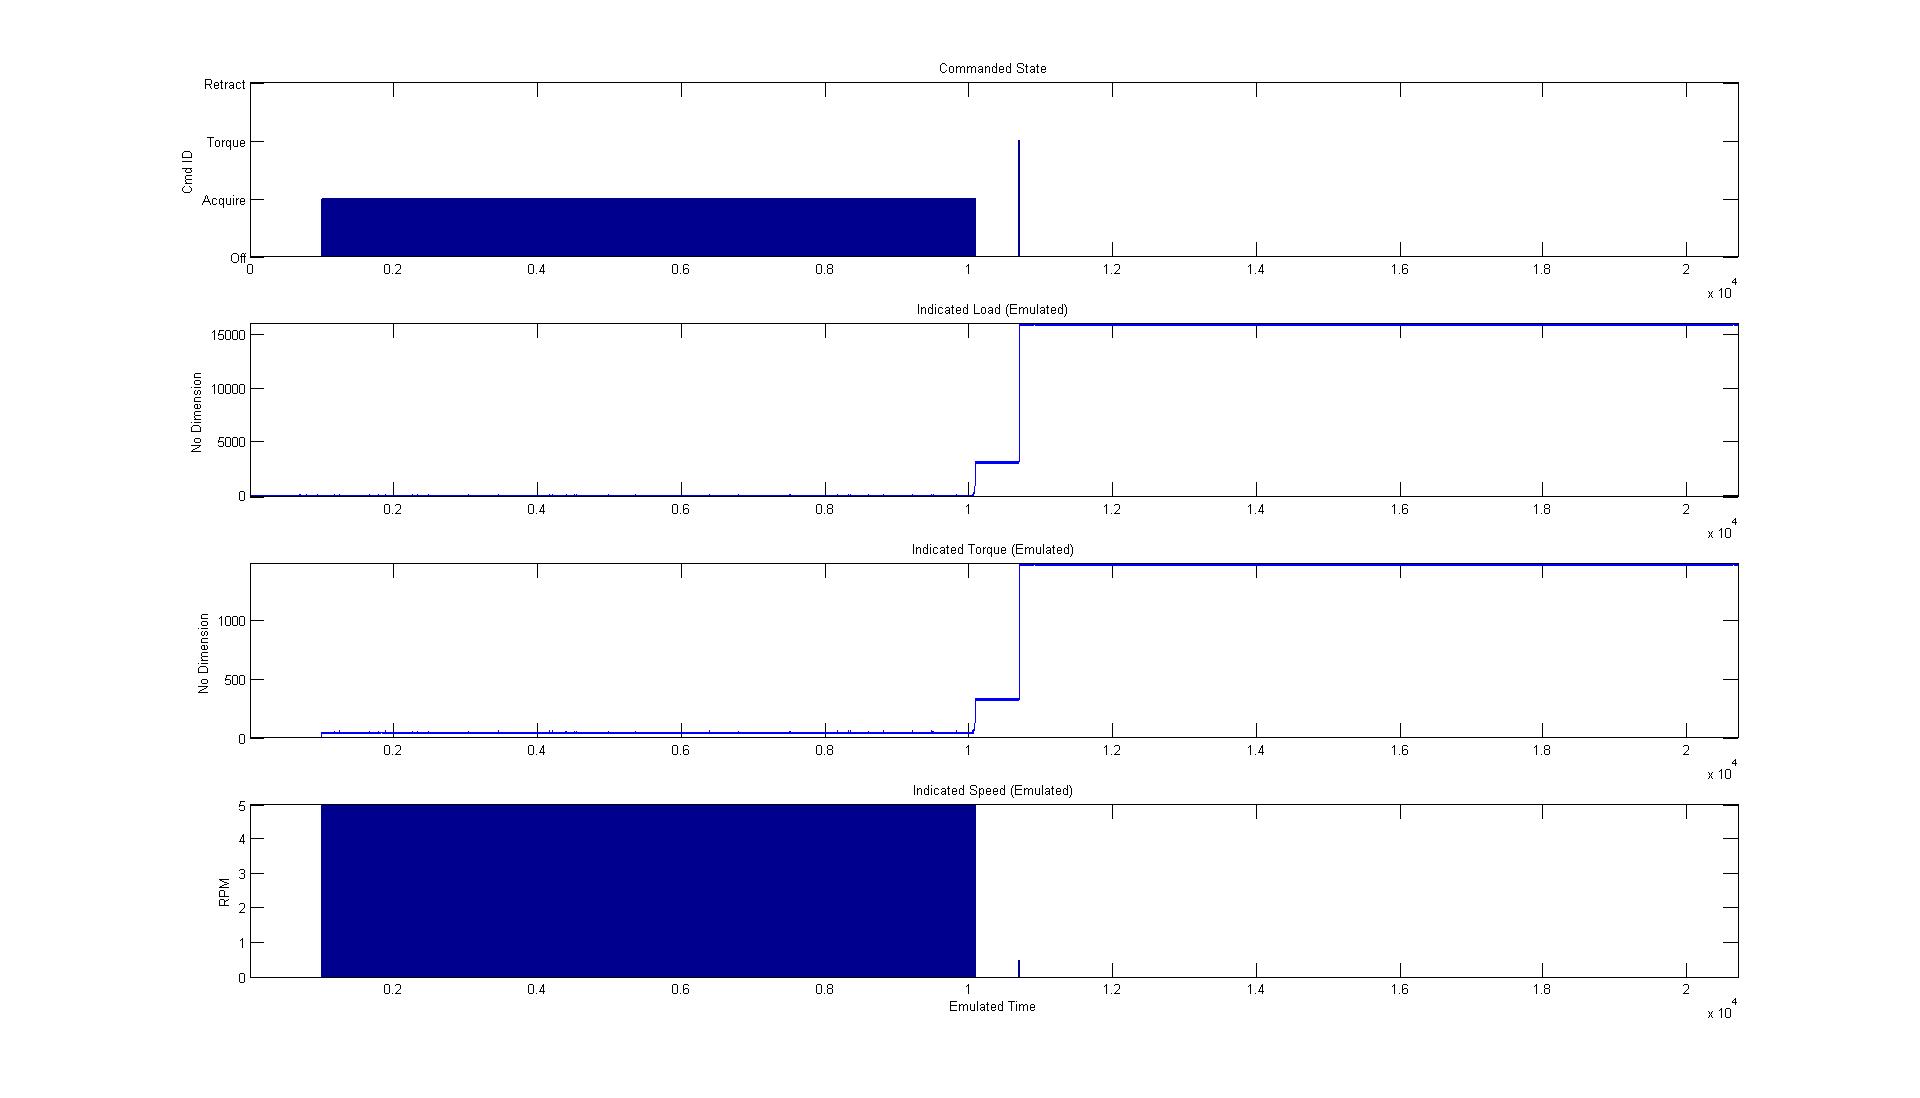
For each individual actuated mechanism, valid data can be plotted to produce something like Figure 21. Different instances of a single mechanism will, of course, show slightly different sensed values, and the two different types of mechanisms exhibit qualitatively different behavior. The important point (here) is that the individual data trajectories are fairly stable with good Signal-to-Noise ratios.
Test Anomaly
Being able to picture the relative stability of nominal data should make it easy for the reader to understand our consternation when the color-coded displays started to blink like a Christmas Tree on meth. Several of the test operators and observers, which included members of the Flight Crew, watched the display while we recorded data for several hours. Eventually, we concluded that the mechanism controllers were not going to recover a nominal state, so we cycled power to the unit. Upon the subsequent power-up, the unit exhibited nominal behavior. The anomalous behavior never returned during later usage2.
Anecdotally, most of the observers took the displays as entirely random. However, some of them were convinced that a few patterns repeated during the event.
Resolution
There being two camps amongst the observers (“purely random” vs. “at least a bit of repetition”), my first concern was to assess the randomization in the recorded data. Bearing in mind my definition of “function” (a controlled change of state), purely randomized data implies that no functions are observable. Data that are not purely random suggest (but do not ensure) that functionality might be observable. The controller SME’s were uniformly committed to the “random data” camp.
Due to the strongly held minority option that differed with the SME position, we proceeded to analyze the data to assess randomness. Such analyses are most easily conducted if multi-channel data can be aggregated into a single vector. Figure 3 shows the results of positionally encoding 15 channels, such that each channel is assigned a multiplier as if occupying a particular power position (e.g., [105,104,103,102,101,100])3.
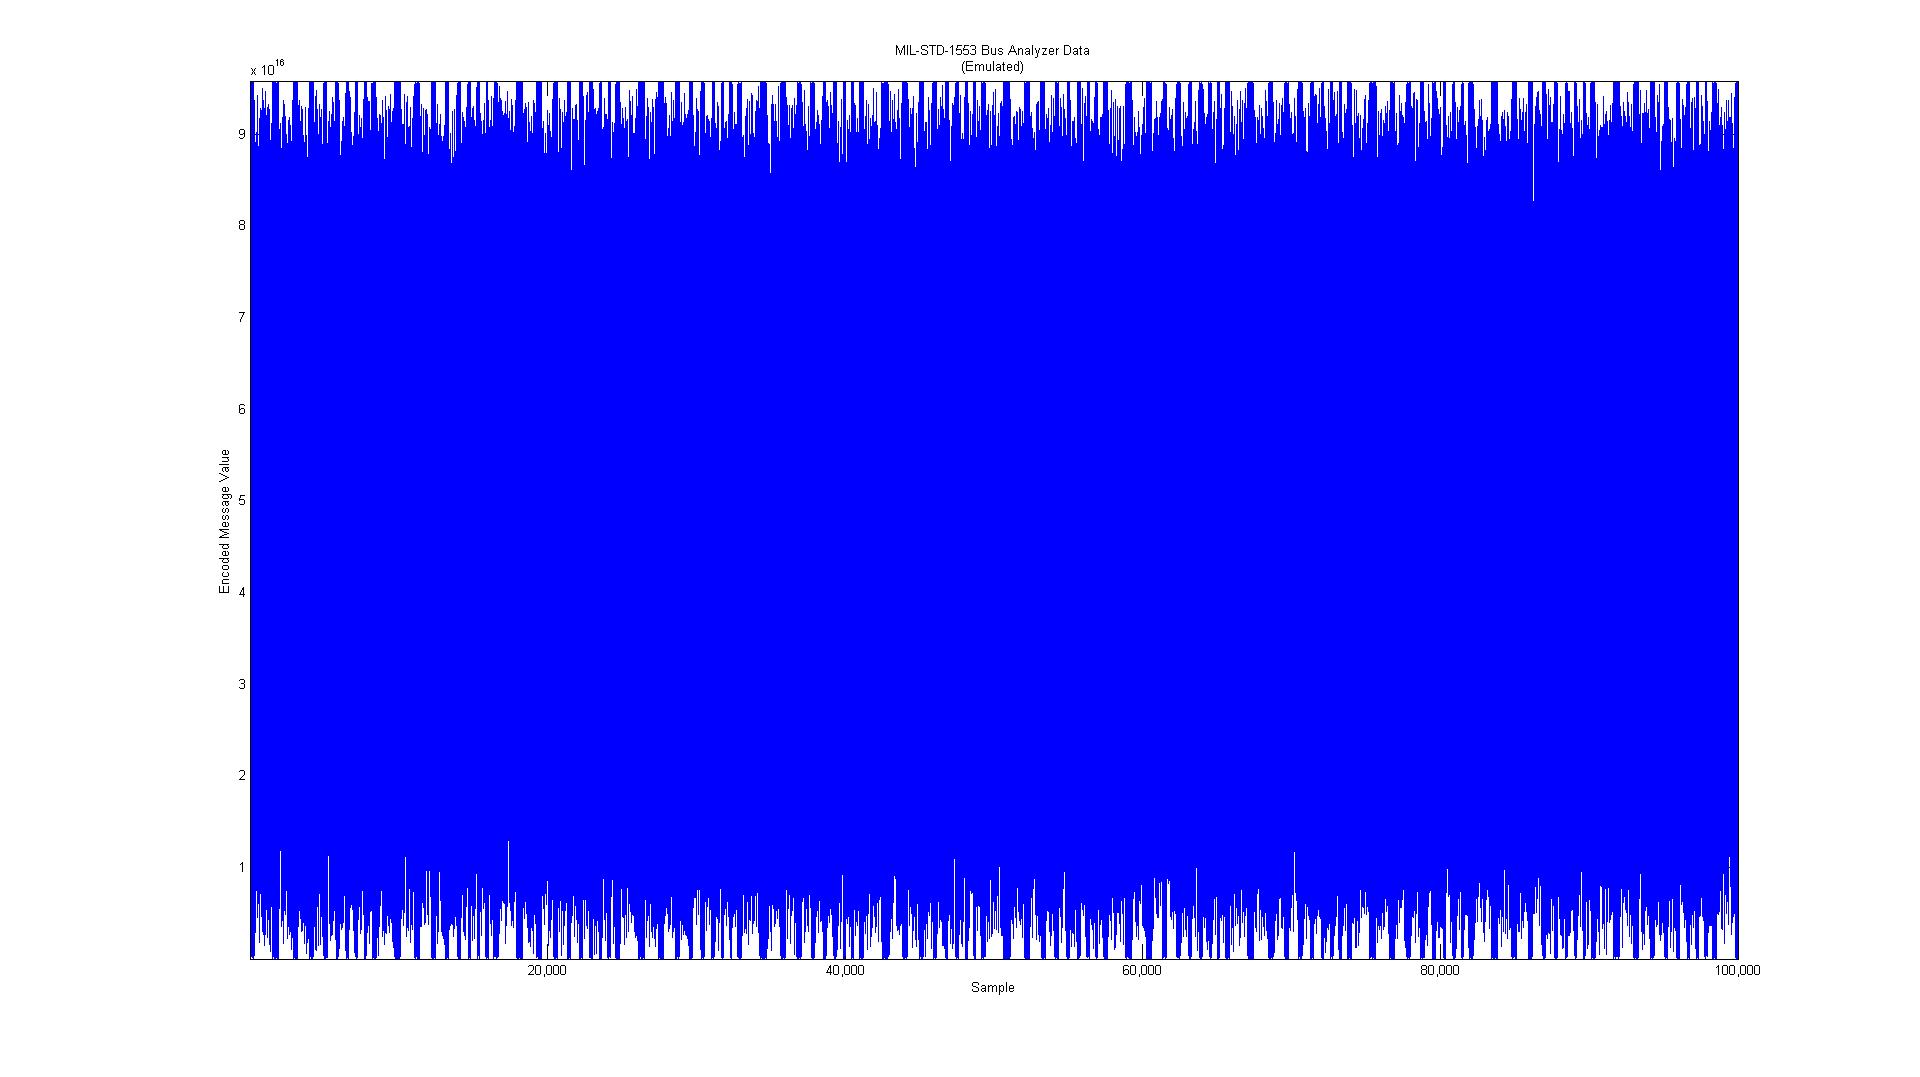
Aggregation of multi-channel data is not the only way to assess raw data with regard to the randomness question, and may not be the most efficient. It is (however) easily explained to non-statisticians, which (in this case) dominated the relevant community SME’s and Big Dogs.
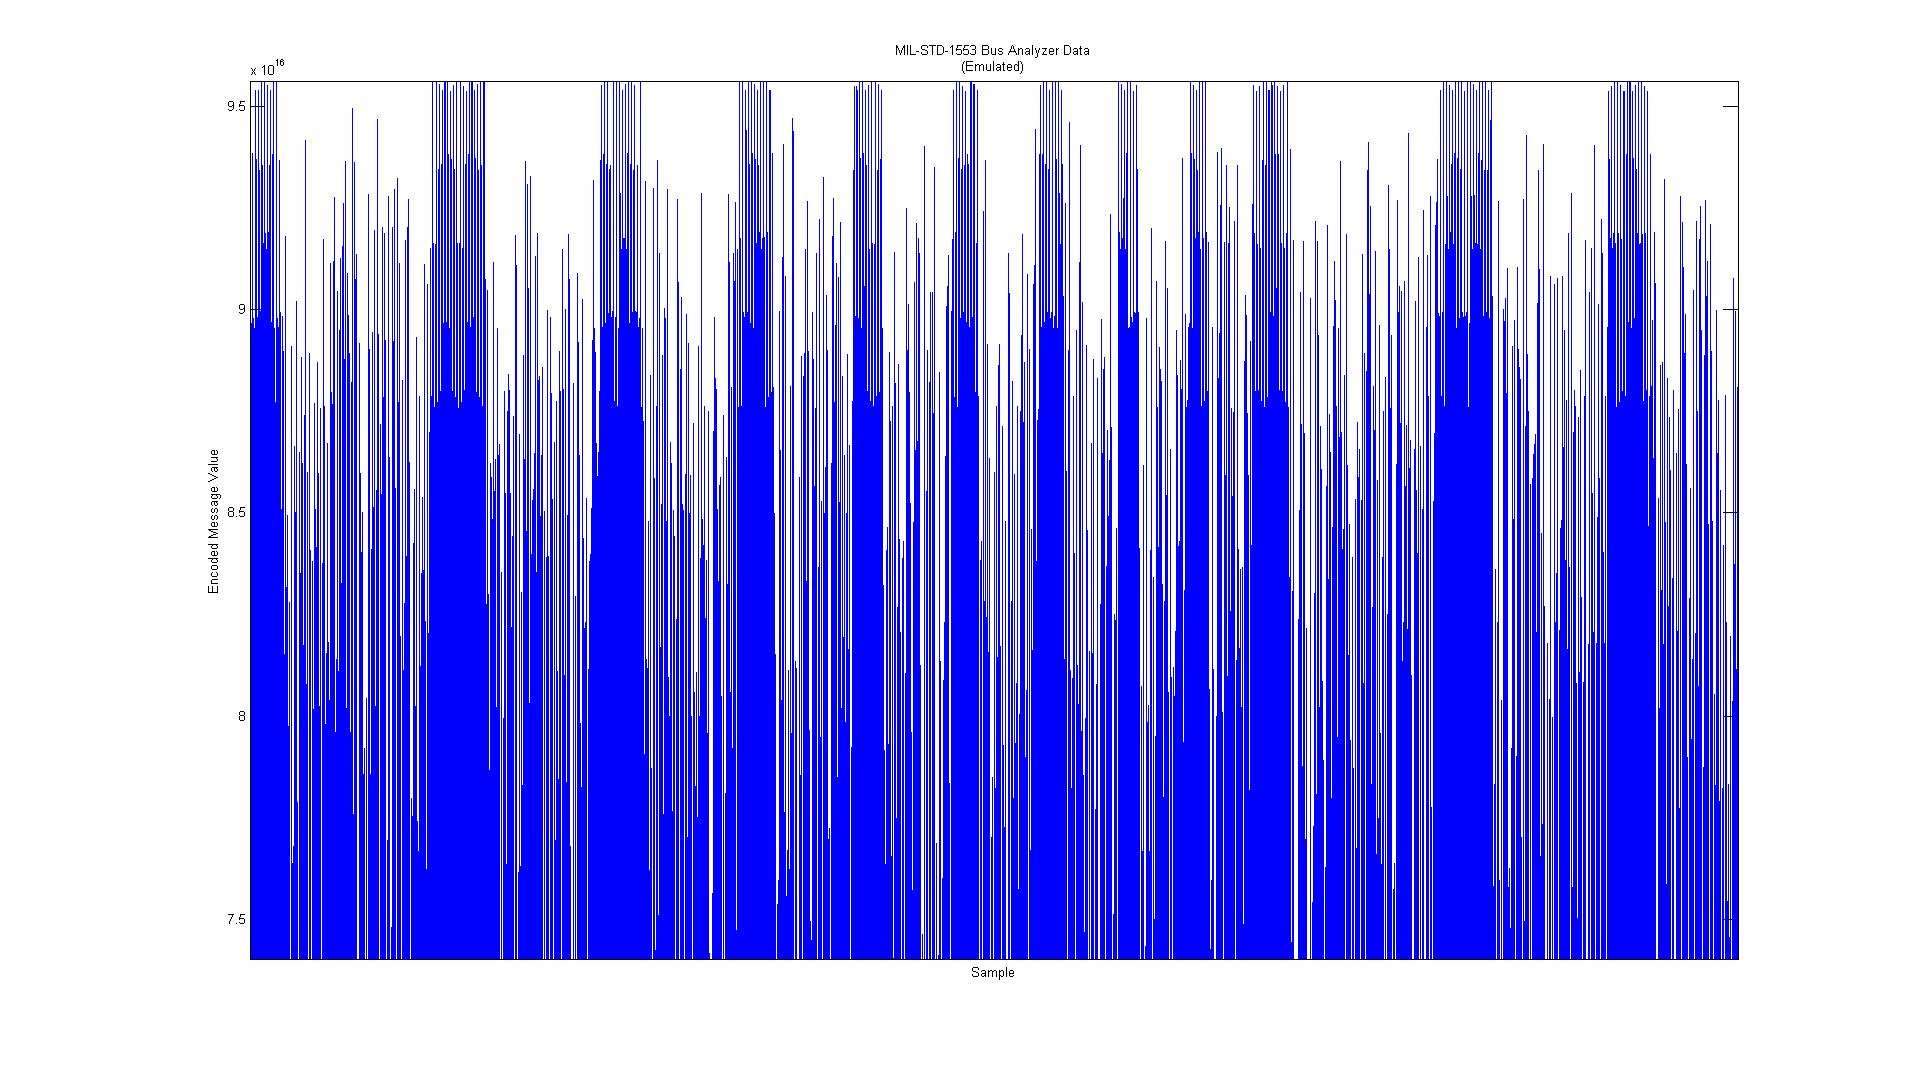
Figure 4 enlarges a portion of Figure 3 to clarify the nature of the emulated raw data. Inspection of the enlarged region suggests (as it did then) that there might be some repeatable behavior, but the suggestion is not strong enough to characterize it directly.
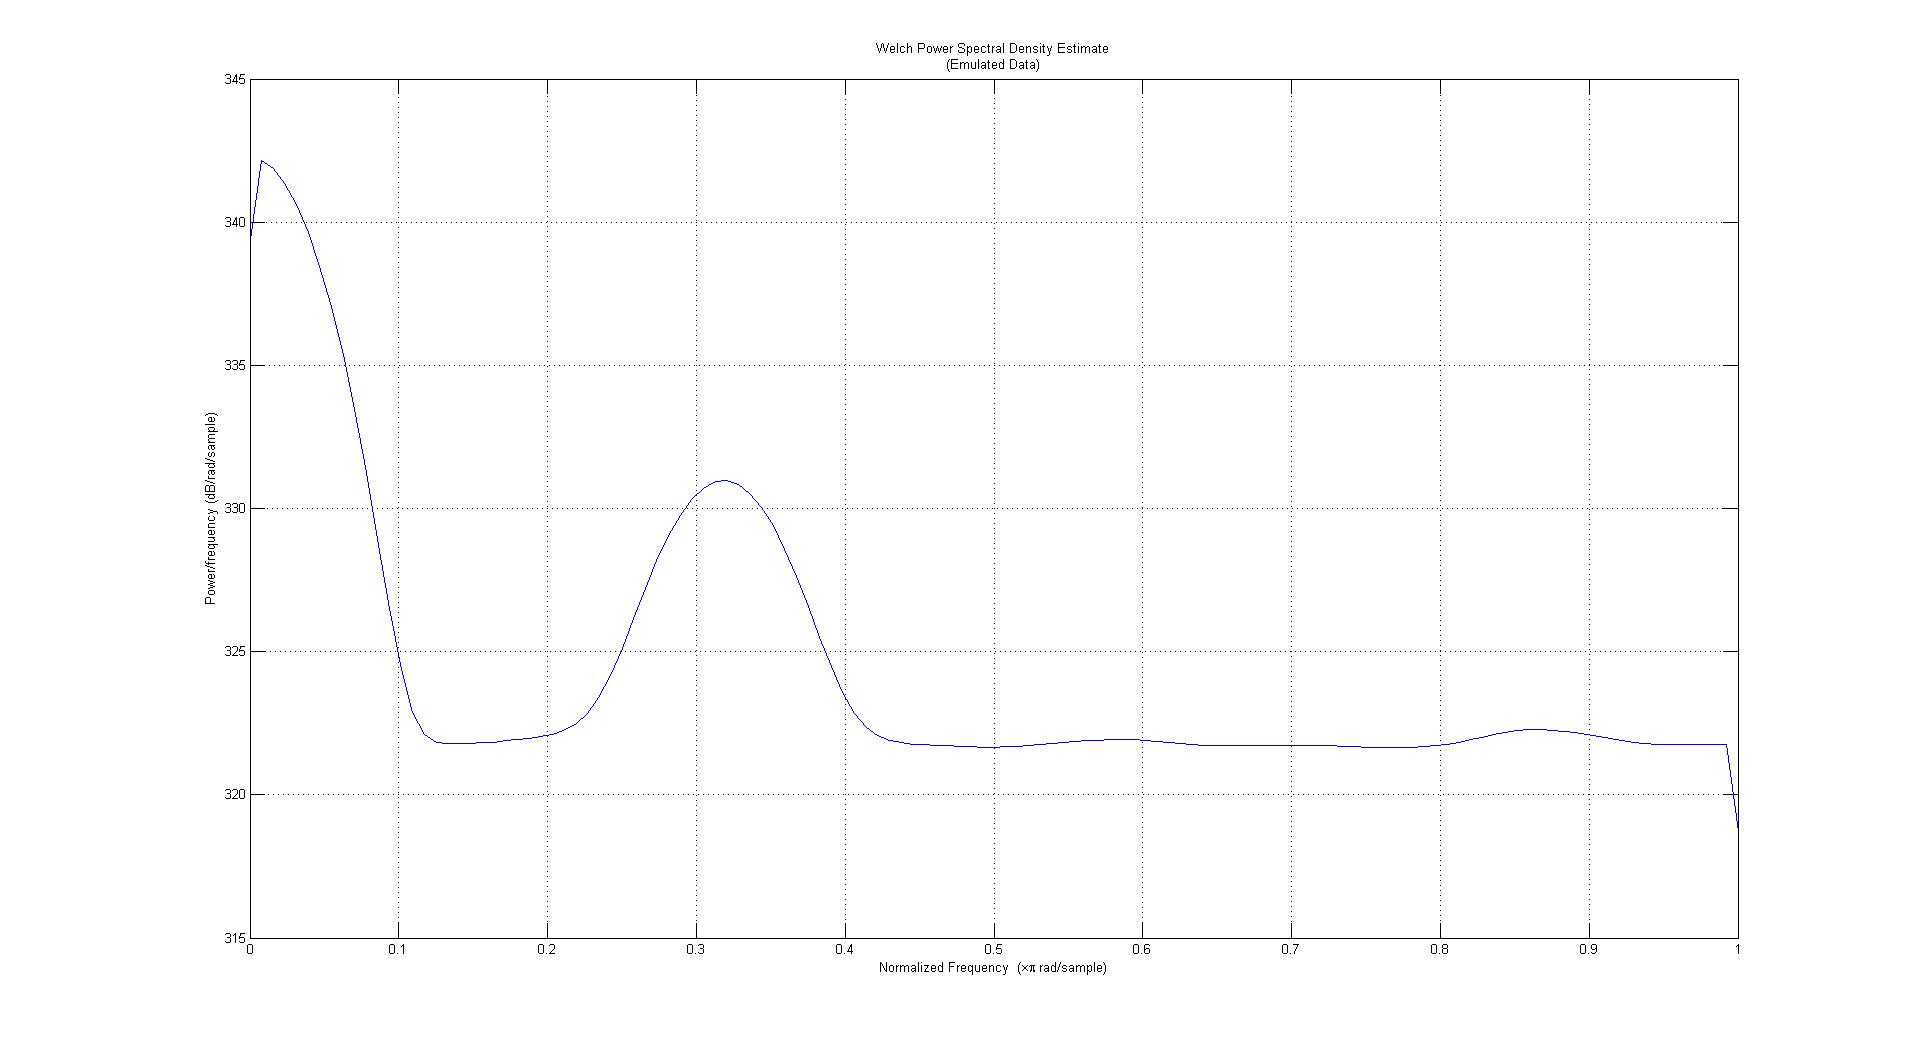
Several techniques are available to explore data when looking for patterns, among the most common of which is to look for strongly represented frequencies. The results of Figure 5’s Power-Spectral Decomposition strongly suggest that significant behavior exists with a normalized frequency of about 0.3 hz. However, direct review of raw data samples by the SME’s did not identify any meaningful sequences of data, so their claim of “randomness” was not refutable on this basis alone.
Adding a bit more analytical complexity, we can also ask whether any particular frequencies are present at some times, but not at others. One such tool is the spectrogram, as shown in Figure 6. An enlargement is shown in Figure 7.

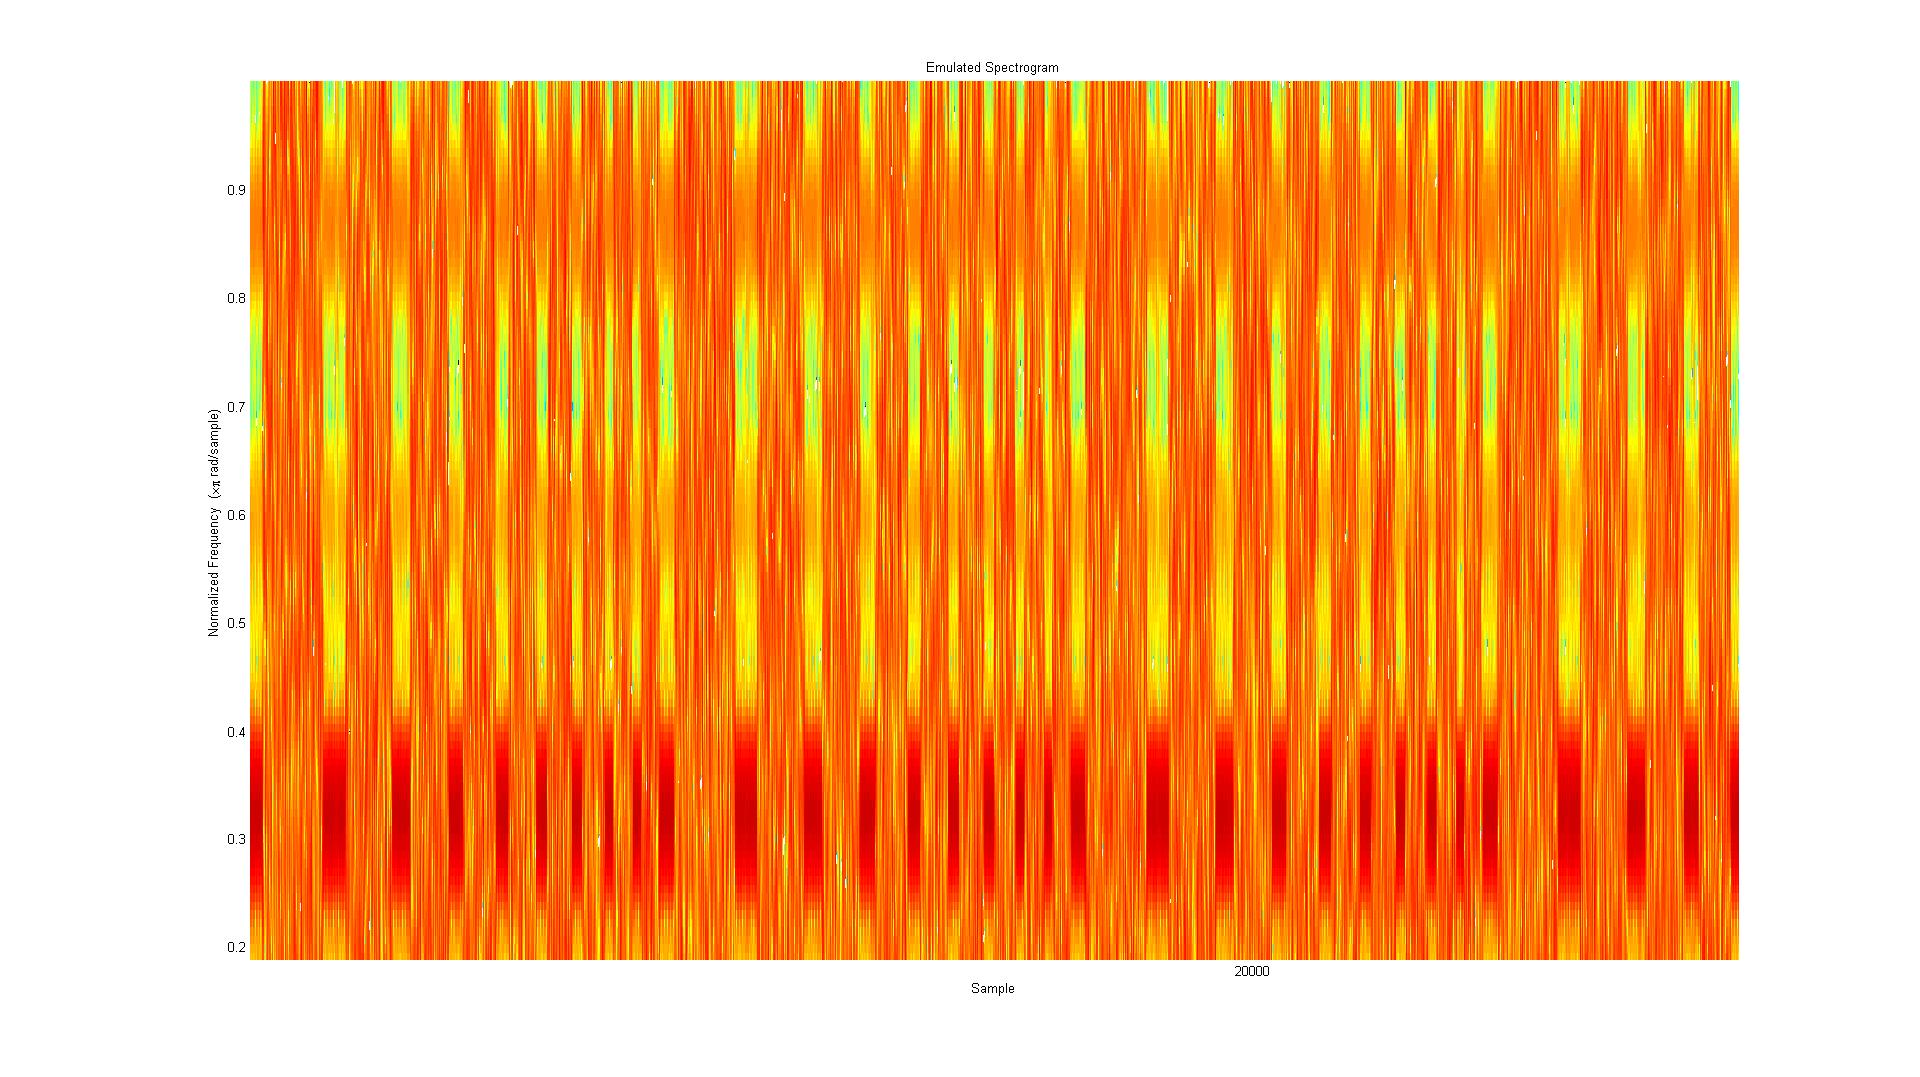
Figure 6 and 7 both show discernible vertical “banding”. Since the ordinate axis is a substitute for time, the bands strongly suggest that the output alternates between periods of random and non-random behavior4. Figure 8 enhances that banding for greater clarity by suppressing the random contribution.
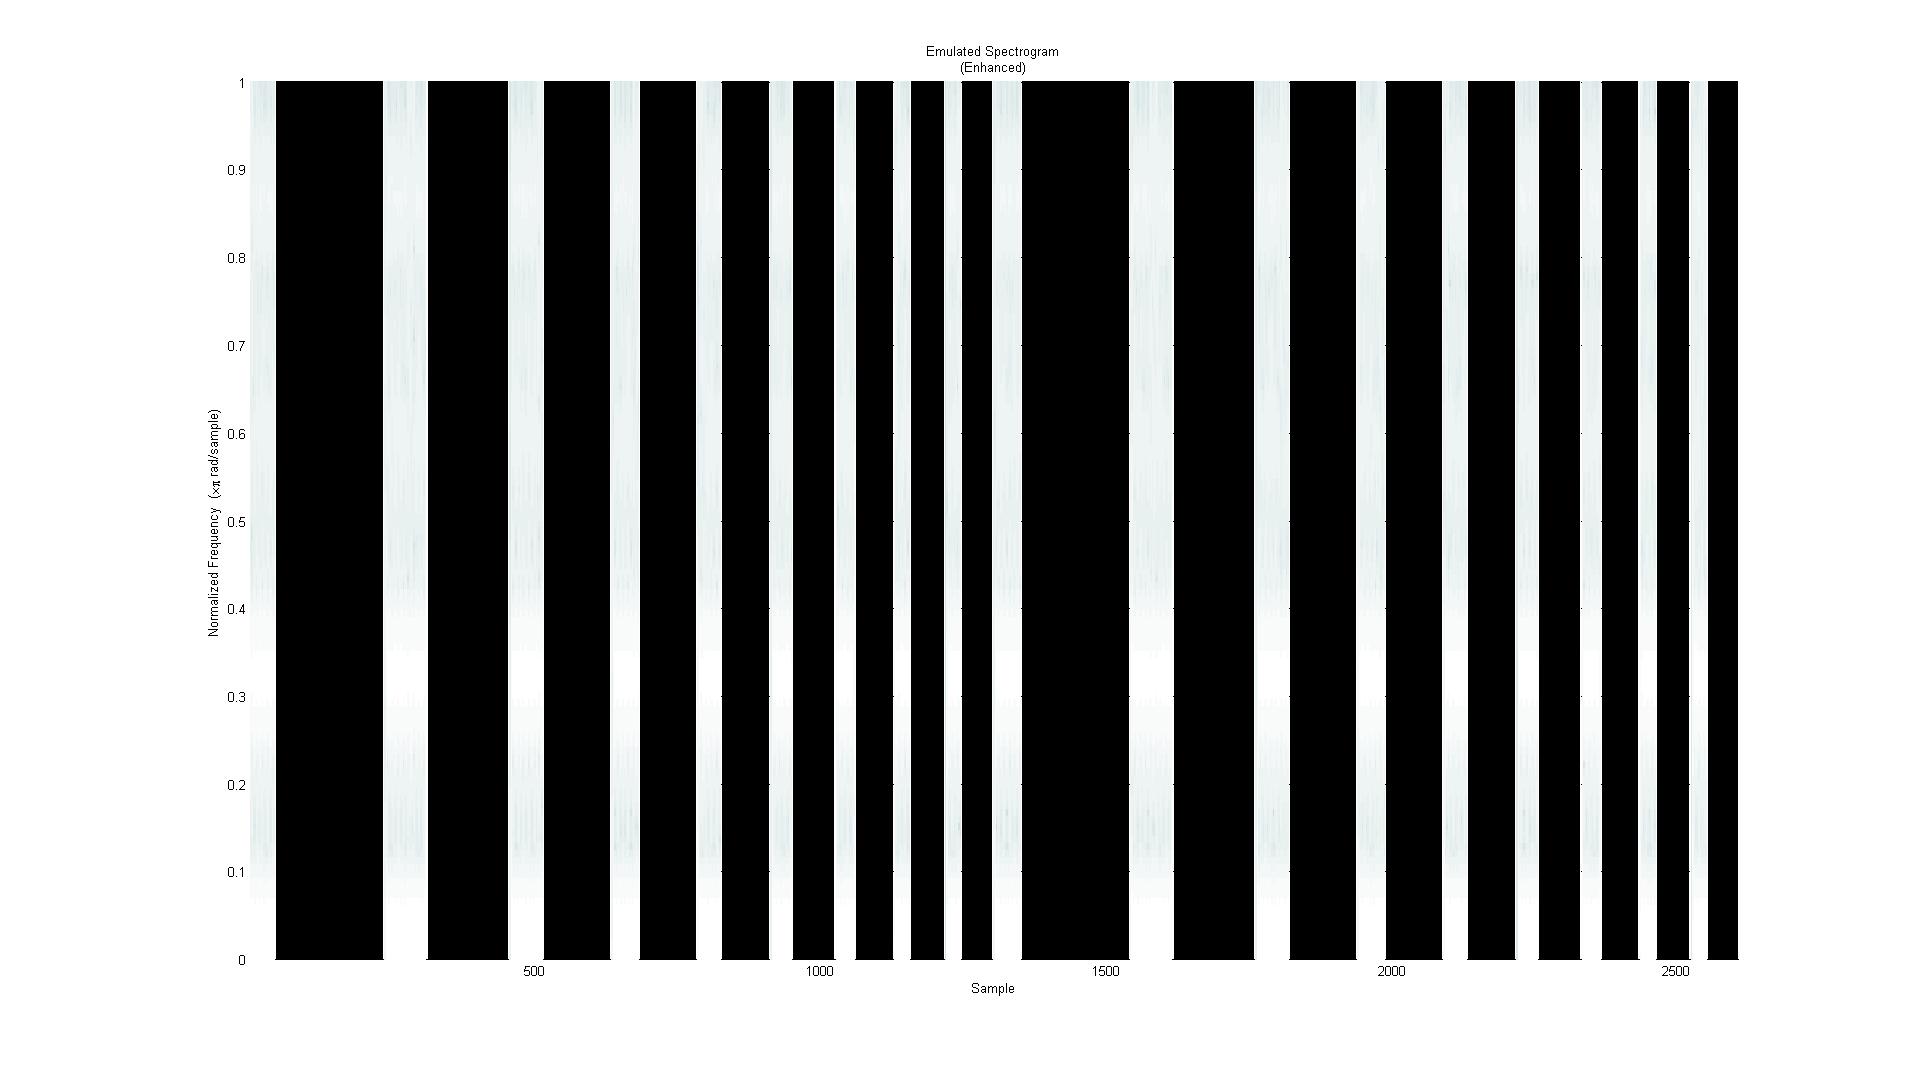
The actual-data version of Figure 8 demonstrated very similar banding, leading to a gestalt moment for one of the controller SME’s: it was similar to the pattern of polling into several loops internal to the electronics of the controller. In short order, the SME’s were able to replicate (in simulation) the behavior of the data by “flipping” a specific bit in a specific register given a specific state of the controller. On this basis, the SME’s were able to conclusively state (and prove) that the function of the controller was, in fact, not altered.
Aftermath
The ability to declare (and substantiate) that the controller’s functionality was not altered during the event proved crucial to accepting the design for flight use. While rare, the anomalous “flipping” of a bit5 was not without precedent. In this case, the Flight Readiness Review panel accepted our explanation of the event even though a Root Cause was not identifiable. As far as I know, the mechanism has successfully performed on orbit without any similar flaws for nearly 20 years.
Footnotes- This is not the operator’s display. It is as if post-processed.[↩]
- covering hundreds of operating hours in the same test setup[↩]
- Here, the data are purely emulated with no attempt to mimic actual values or timing. The approach to identifying the presence of functionality is, however, essentially as followed in the original trouble-shooting operation.[↩]
- The random periods spread the red-orange colors more evenly in the vertical direction. The non-random periods concentrate into interrupted horizontal banding that alternates between yellow and red.[↩]
- Sometimes referred to as a “single event upset”[↩]